Configuring the Status Check Monitoring Dashboard
How to configure the Status Check Monitoring Dashboard?
-
Open Blueprints and select the required Blueprint.
-
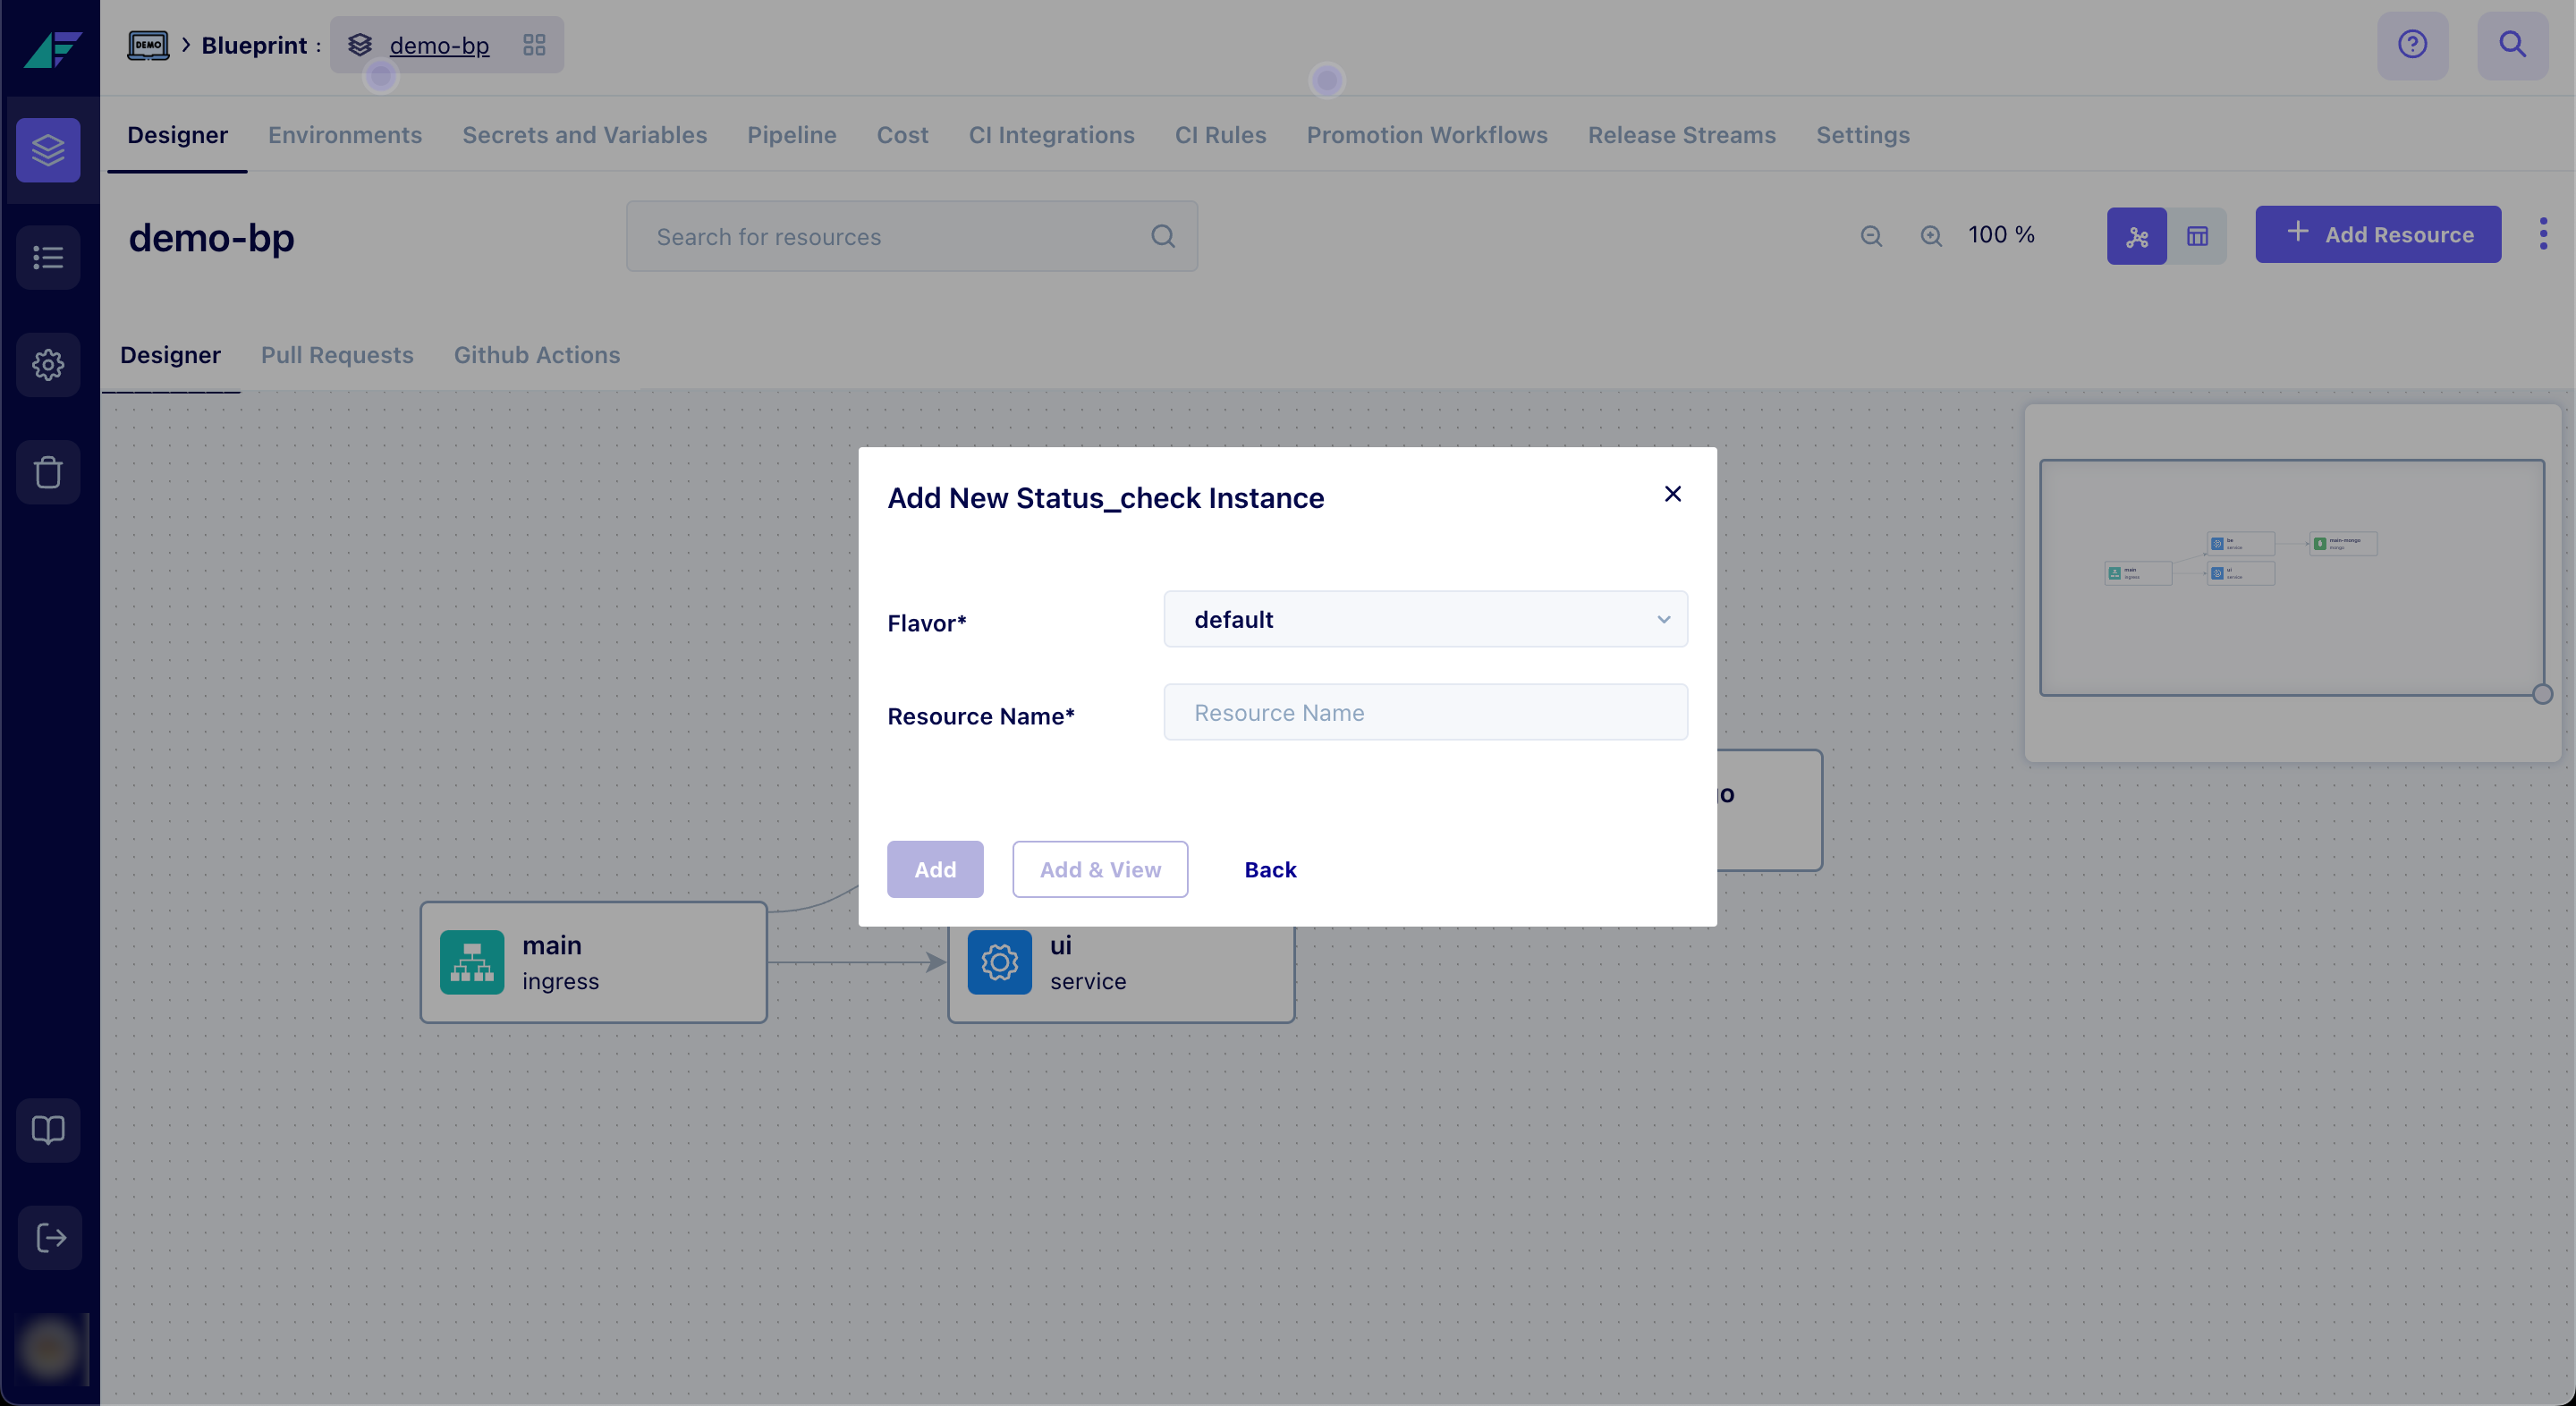
Select the Designer tab and click Add Resources.
-
In the pop-up window, search for and select the resource type Status Check.
-
Provide a Name for the resource and click Add and View.
Note: When creating a resource, it is initially set with default sample values that can be modified after the resource has been created.
Click on the image to expand
-
Customize the checks to match your specific needs. A sample status check is provided below:
Example status check:
In the following case, this configuration will perform a GET request to retrieve the status of the resource. If the status code is 200, it will be marked as healthy.
"be-check": {
        "url": "http://${service.be.out.interfaces.http.host}/",
        "method": "GET",
        "expected_status_code": "200"
        },
You have successfully configured the Uptime Dashboard.
How to Access the Dashboard?
- Select the Environment in your defined Blueprint and select the Tools tab at the top.
- Select the Grafana tab.
- Click on the Search button, search for the Status Check Monitoring dashboard in the search menu, and open the same.
- You can now view the status of the resources in a tabular format.
How to subscribe to Status Check Alert Notifications?
-
Navigate to Settings > Notifications to access the Notifications section.
-
Select the Subscriptions tab and click Create Subscription.
-
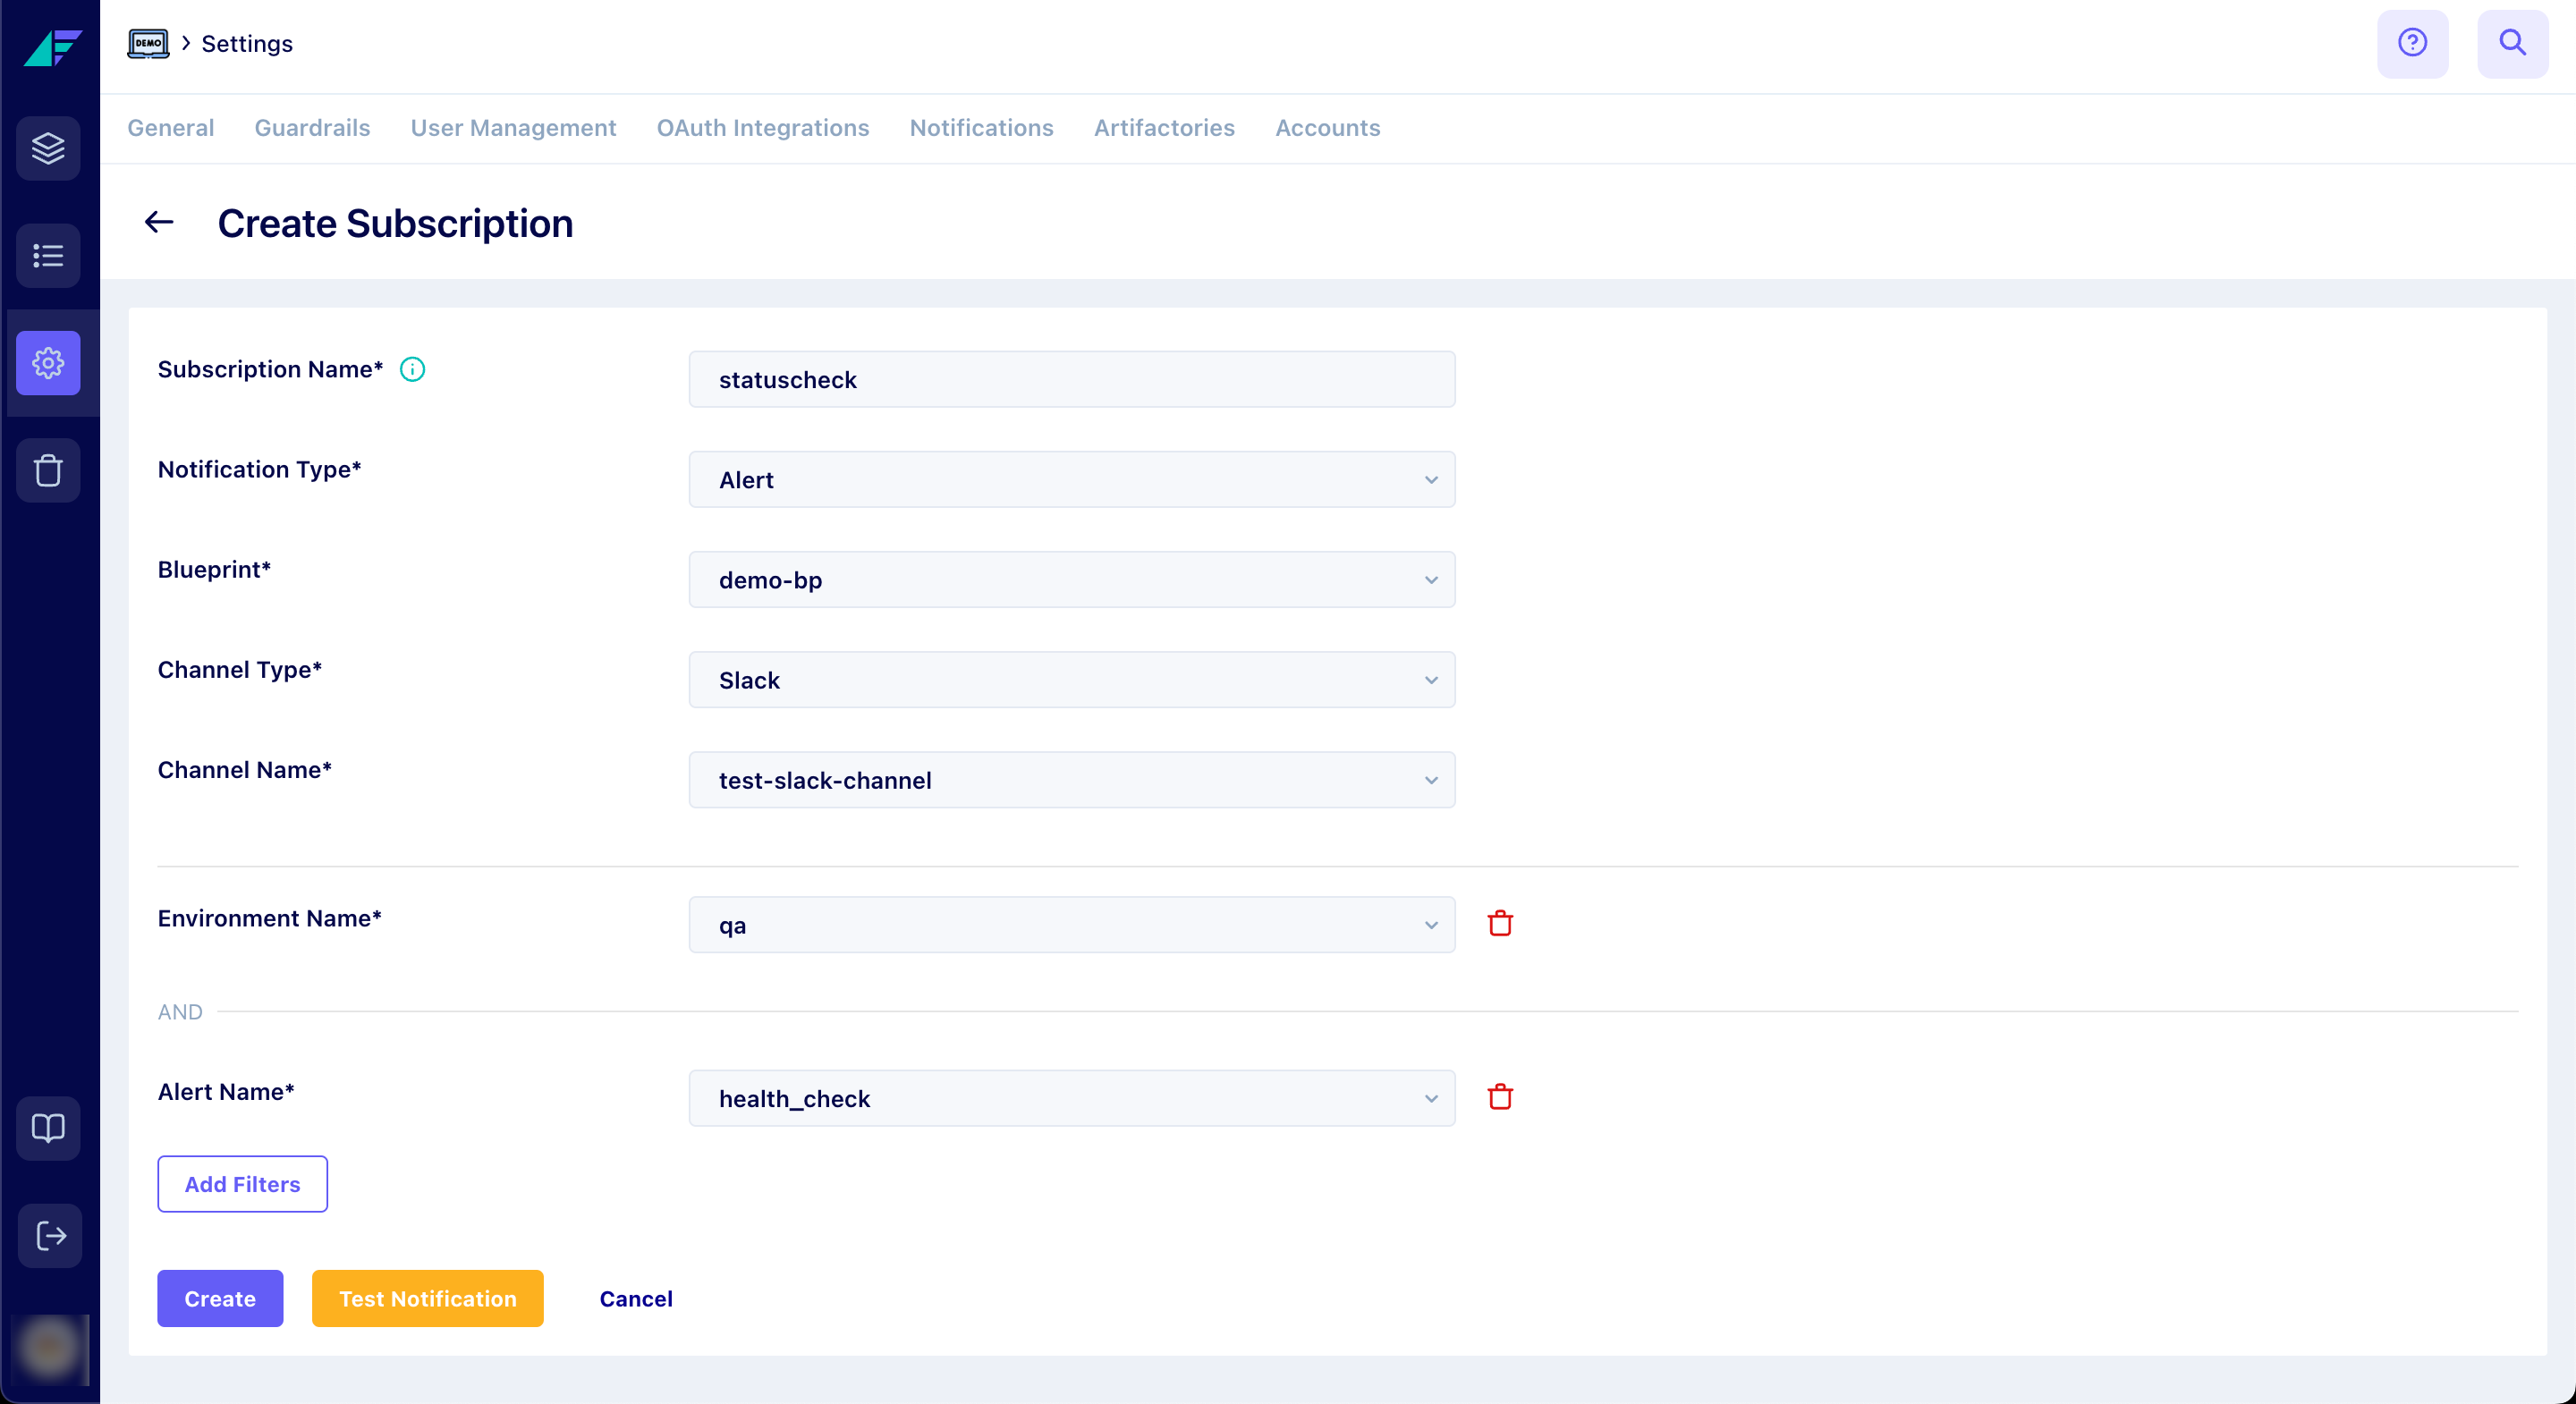
Here, mention the Subscription Name, Notification Type, Blueprint, Channel Type, and Channel Name.
-
Next, click on Add Filters. Select Environment Name from the dropdown and select the environment.
-
Click Add Filters again. This time, select Alert Name from the dropdown and select health_check.
-
To ensure everything is set up correctly, click Test Notifications. This will send a test alert to your chosen channel.
-
Click Create.

Click on the image to expand
You have successfully set up Status Check Alert Notifications.
Updated 12 months ago