Creating a Custom Grafana Dashboard
Prerequisite
Ensure you have write access to the Blueprint, access to overrides, and the ability to perform a full release.
How to create a Custom Grafana Dashboard?
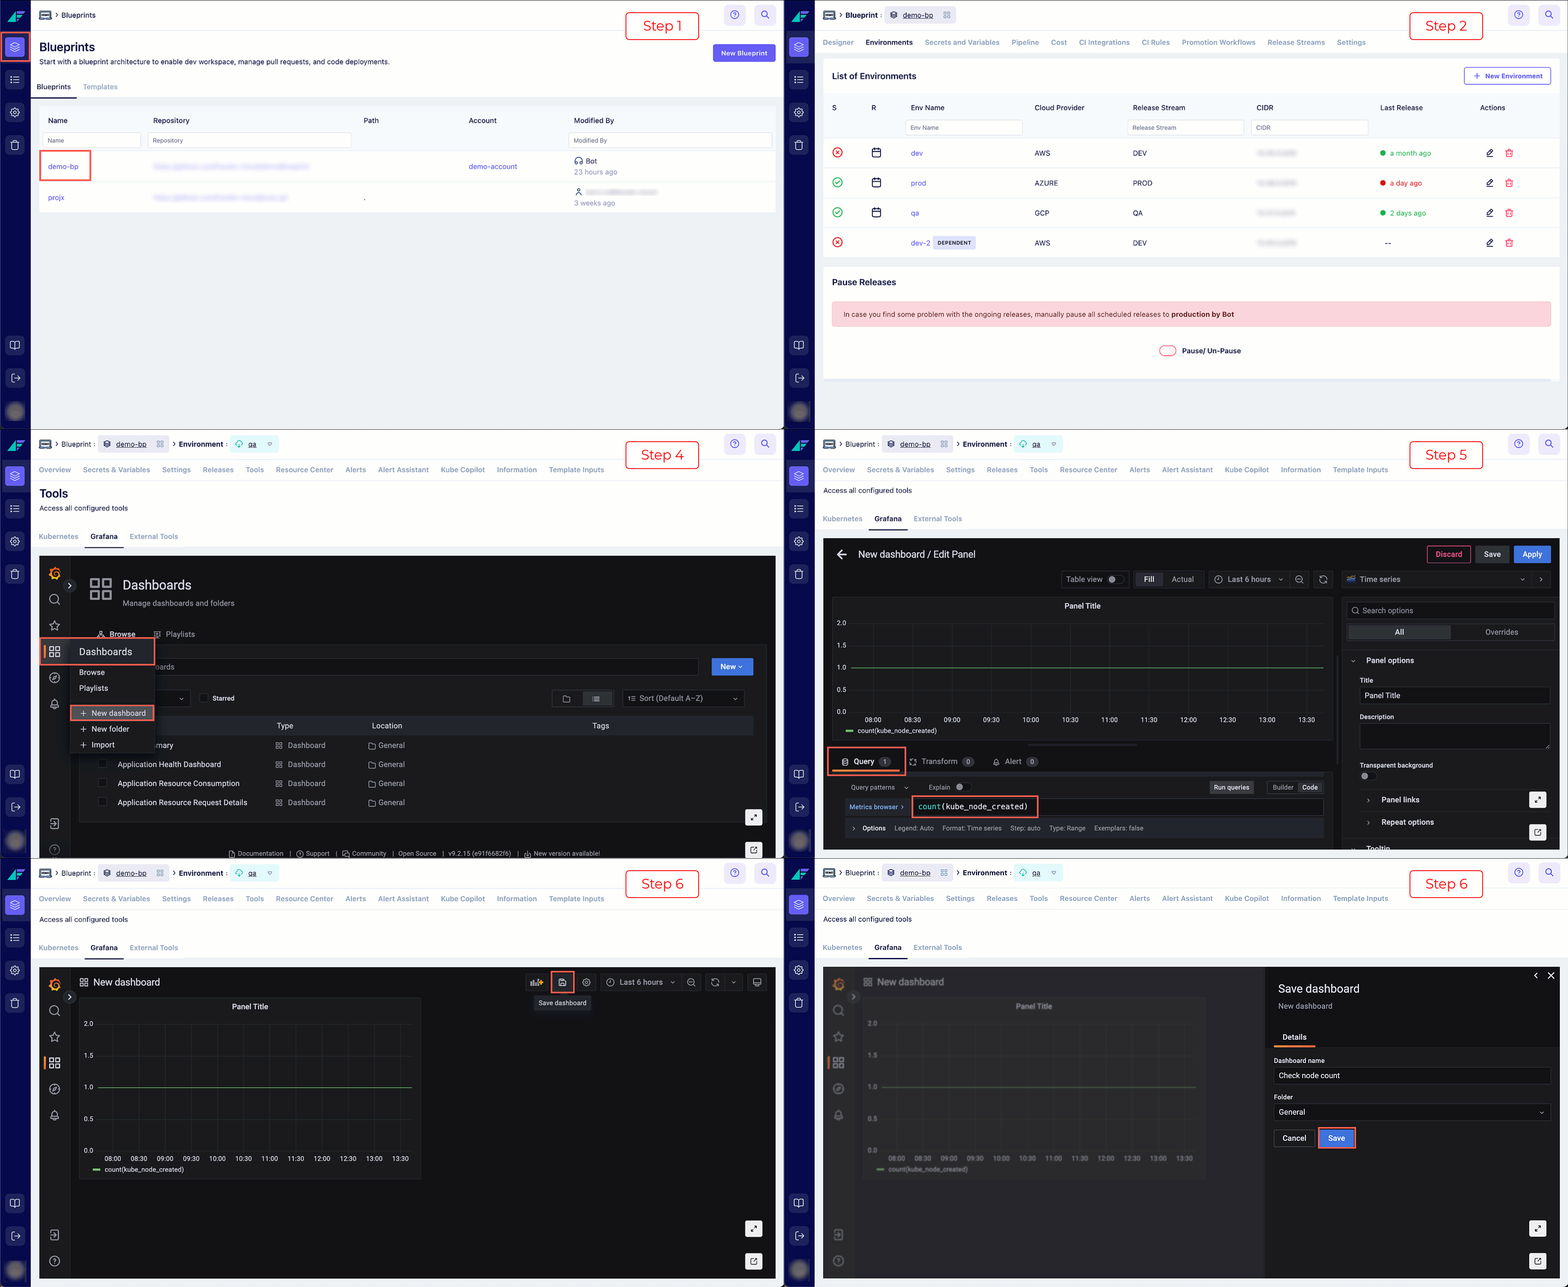
- Open the Projects tab and select the required project.
- Select the desired environment in which you wish to create a grafana dashboard.
- Here, select Tools > Grafana.
- In Grafana, select Dashboard > New Dashboard and click Add a new panel.
- Under the Query section, input your queries and click Apply.
For instance, creating a dashboard to monitor the node count in time series. - Click the Save icon. Here, mention the Dashboard Name and click Save.

Click on the image to expand
You have successfully created a custom Grafana dashboard.
How to add the Custom Grafana Dashboard in Facets?
- Click on the Share dashboard or panel icon.
- In the pop-up, select the Export tab and click Save to file. The JSON file will be saved locally.
- Navigate to the Designer tab of this Project.
- Click Add Resource, then search for and select the Grafana dashboard.
- Select the Flavor, enter the Resource Name and click Add & View.
- Edit the JSON. In
annotationssection, replace the current contents with the contents of the locally saved JSON file. - Click Save Changes.
- Enable the resource and perform a Full Release.
You have successfully deployed a custom Grafana dashboard tailored to your specific monitoring needs.
Updated 9 months ago