Resource: Live Insights & Operations
The Live tab offers real-time insights and management capabilities for your cloud resources. It provides a comprehensive view of pipeline activities, Kubernetes workloads, Terraform outputs, and monitoring dashboards.
Use Cases
- Real-Time Monitoring: Observe live deployment statuses and resource metrics to ensure system health and performance.
- Deployment Management: Oversee and control deployment pipelines, including version rollbacks and promotions.
- Kubernetes Operations: Manage Kubernetes workloads with actions like rolling restarts and scaling adjustments.
- Infrastructure Outputs Access: Retrieve and utilise Terraform outputs for seamless integration and configuration.
- Resource Monitoring: Utilise Grafana-powered dashboards to monitor CPU usage, memory consumption, and pod restarts.
Functionalities
1. Pipeline Activity
This section displays the current state and version history segmented into:
- Build Registered: Tracks the changes to the artifact being deployed.
- Blueprint Activity: Monitors changes and deployments related to the blueprint configurations.
- Override Activity: Logs modifications applied to the resources as overrides.
Each category presents:
- Live Version: The version currently deployed.
- Release Pending Version: The version queued for deployment.
- Version History: An expandable table detailing past versions with timestamps and statuses.
The Version History table includes a rollback feature, allowing you to revert to a specific version if necessary.
2. Kubernetes Dashboard
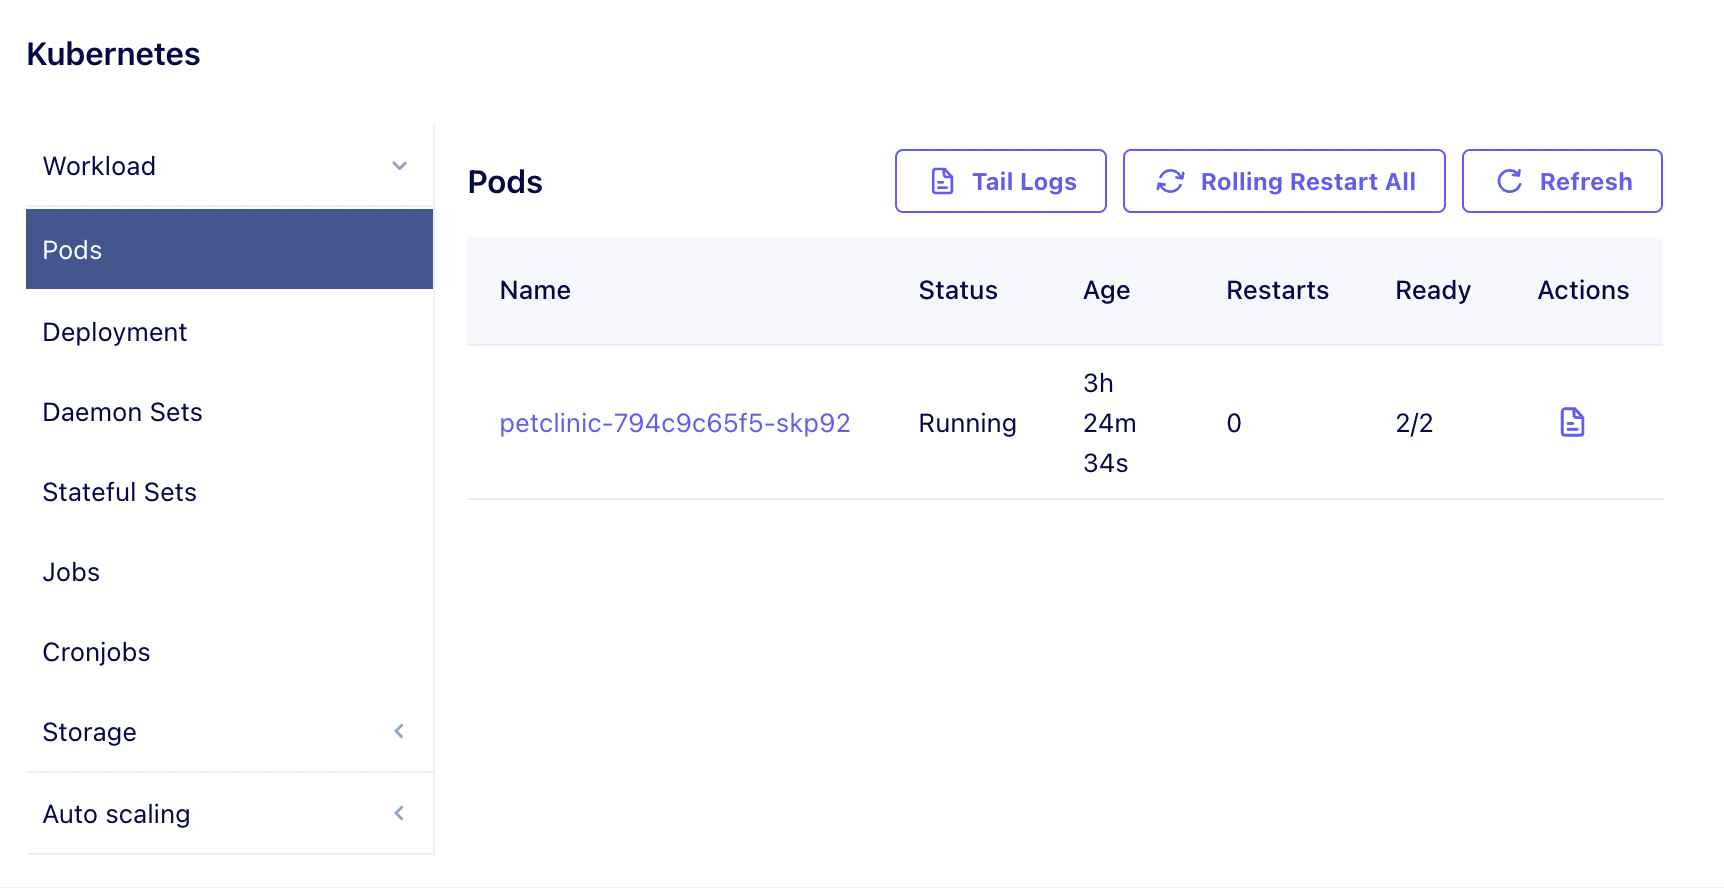
This dashboard offers a live overview of your Kubernetes cluster, covering:
-
Workloads:
- Pods: Displays status, age, restarts, readiness, and available actions.
- Deployments, DaemonSets, StatefulSets, CronJobs, Jobs: Provides insights into the state and performance of various controllers and jobs.
-
Storage:
- Persistent Volume Claims (PVCs) and Persistent Volumes (PVs): Shows storage allocations, statuses, and capacities.
-
Autoscaling:
- Horizontal Pod Autoscalers (HPAs): Monitors scaling activities and metrics.
For Pods, the following actions are available:
- Rolling Restart: Gracefully restarts pods to apply updates or recover from issues.
- Refresh: Updates the pod list to reflect the current state.
- Promote: Advances a pod to a stable release, particularly useful in blue-green or canary deployments.
- Abort: Terminates a deployment in progress, applicable during blue-green or canary strategies.
3. Terraform Outputs
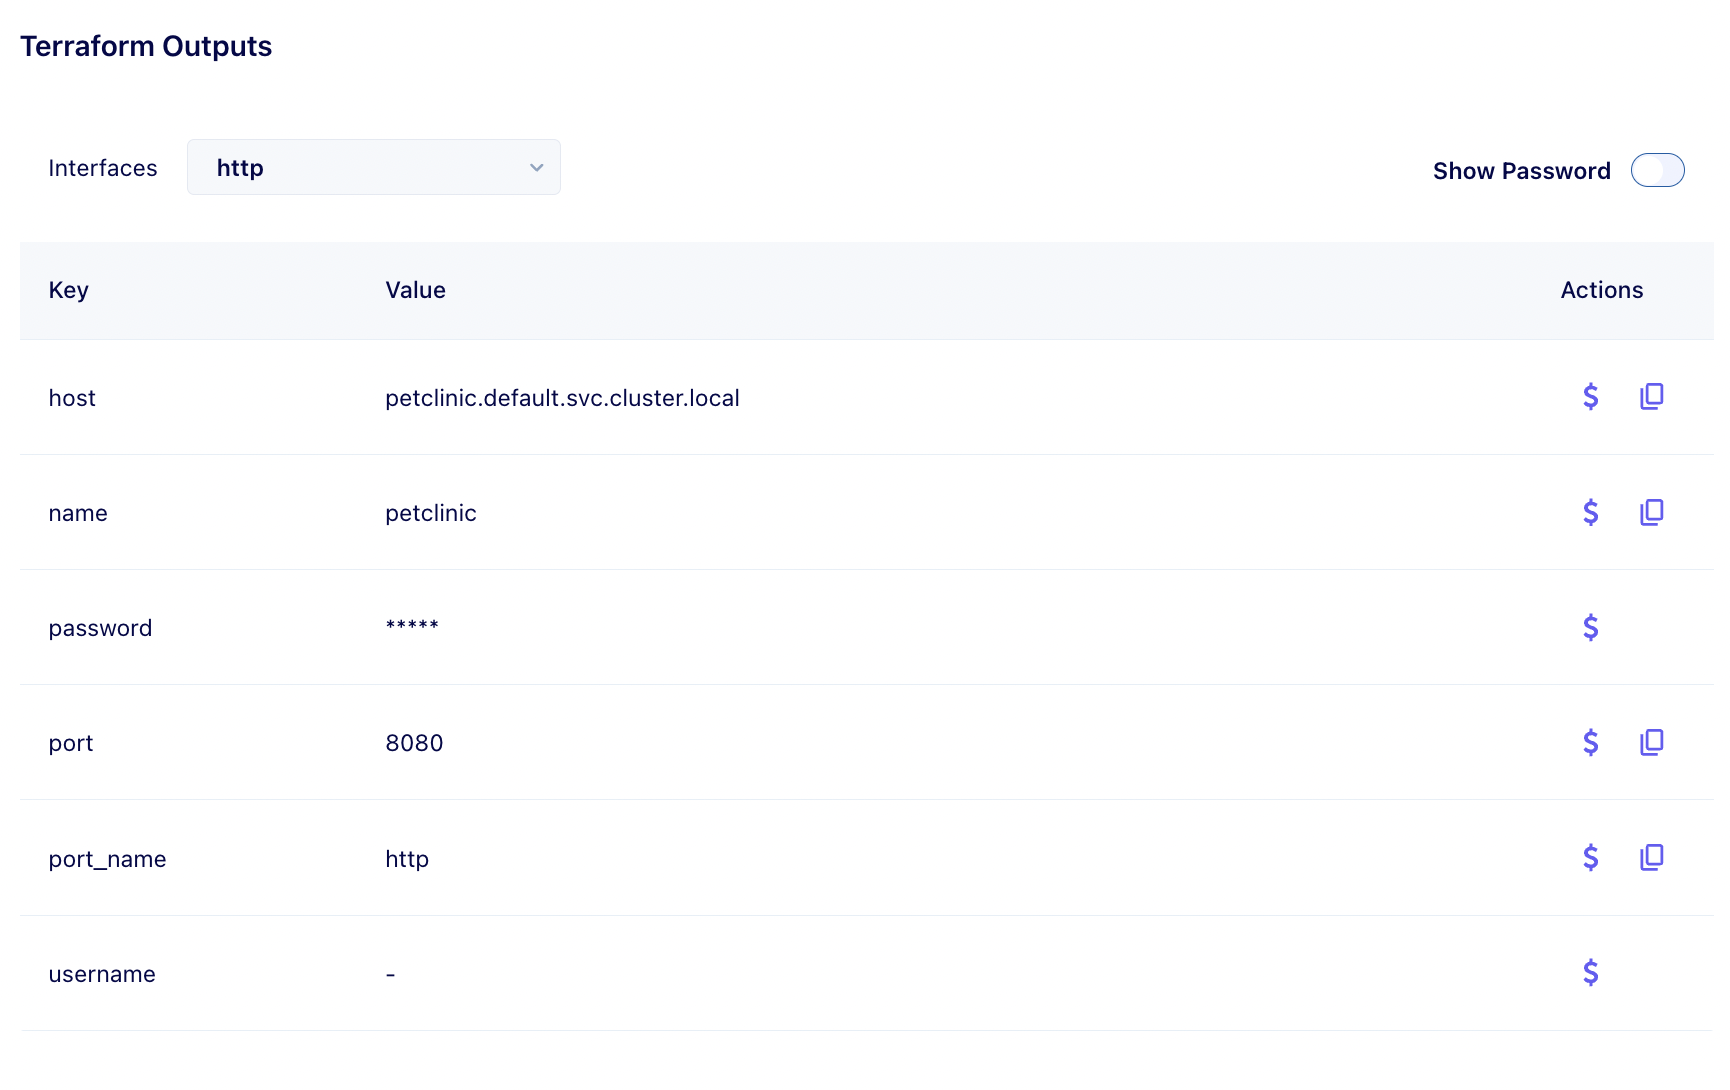
This section displays the outputs from your Terraform configurations, including:
- Interfaces: Endpoints or connection details exposed by your resources.
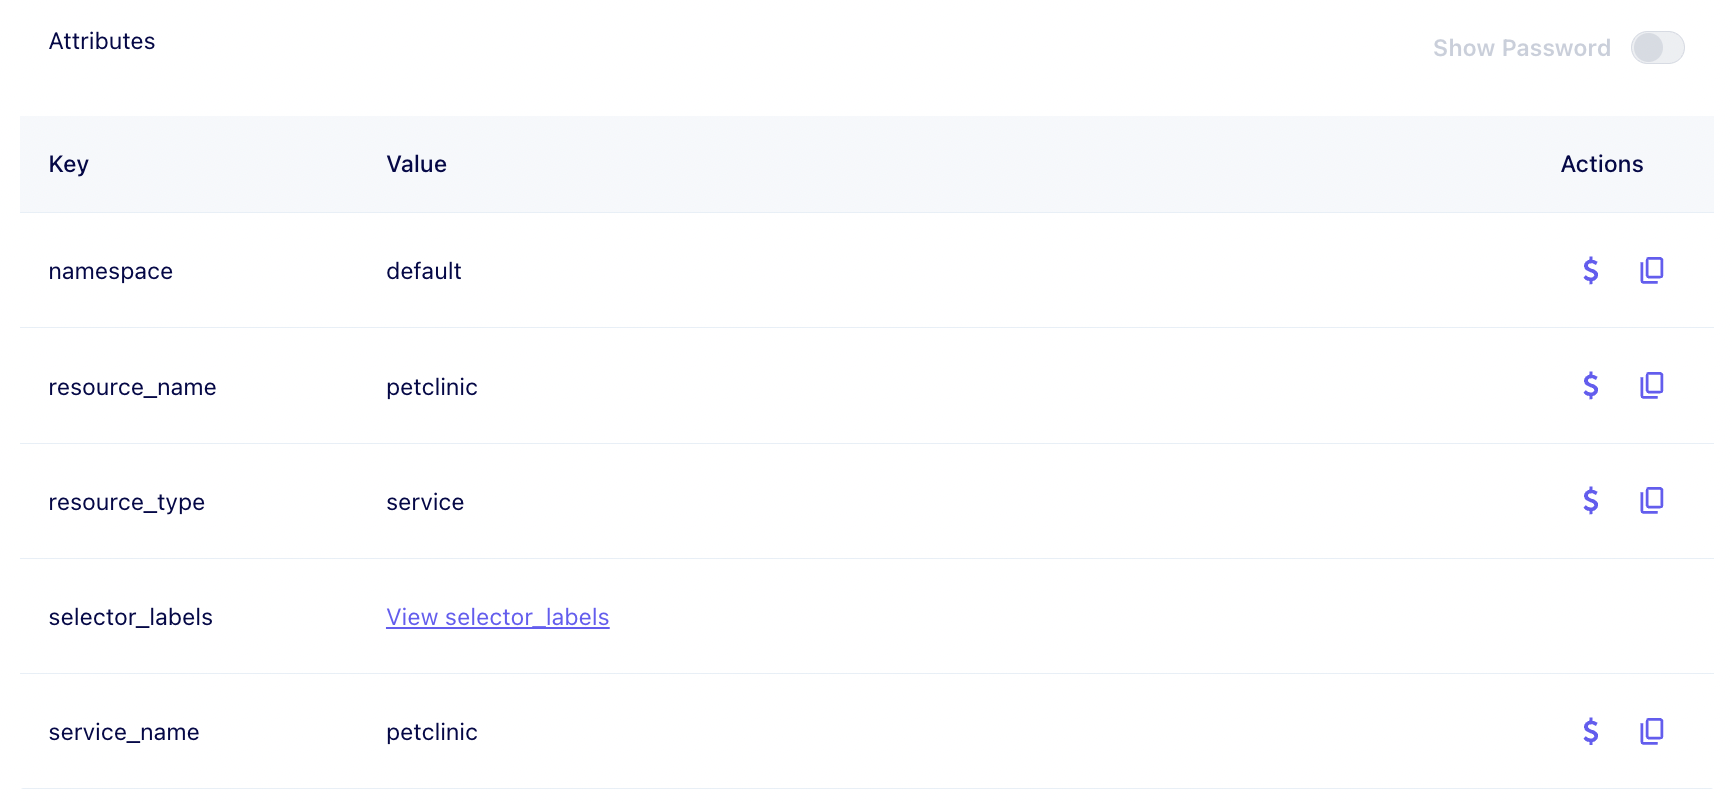
- Attributes: Key-value pairs representing resource properties.
Each output offers action buttons to copy names and dollar references ($refs) for seamless integration into your configurations.
4. Monitoring Dashboards
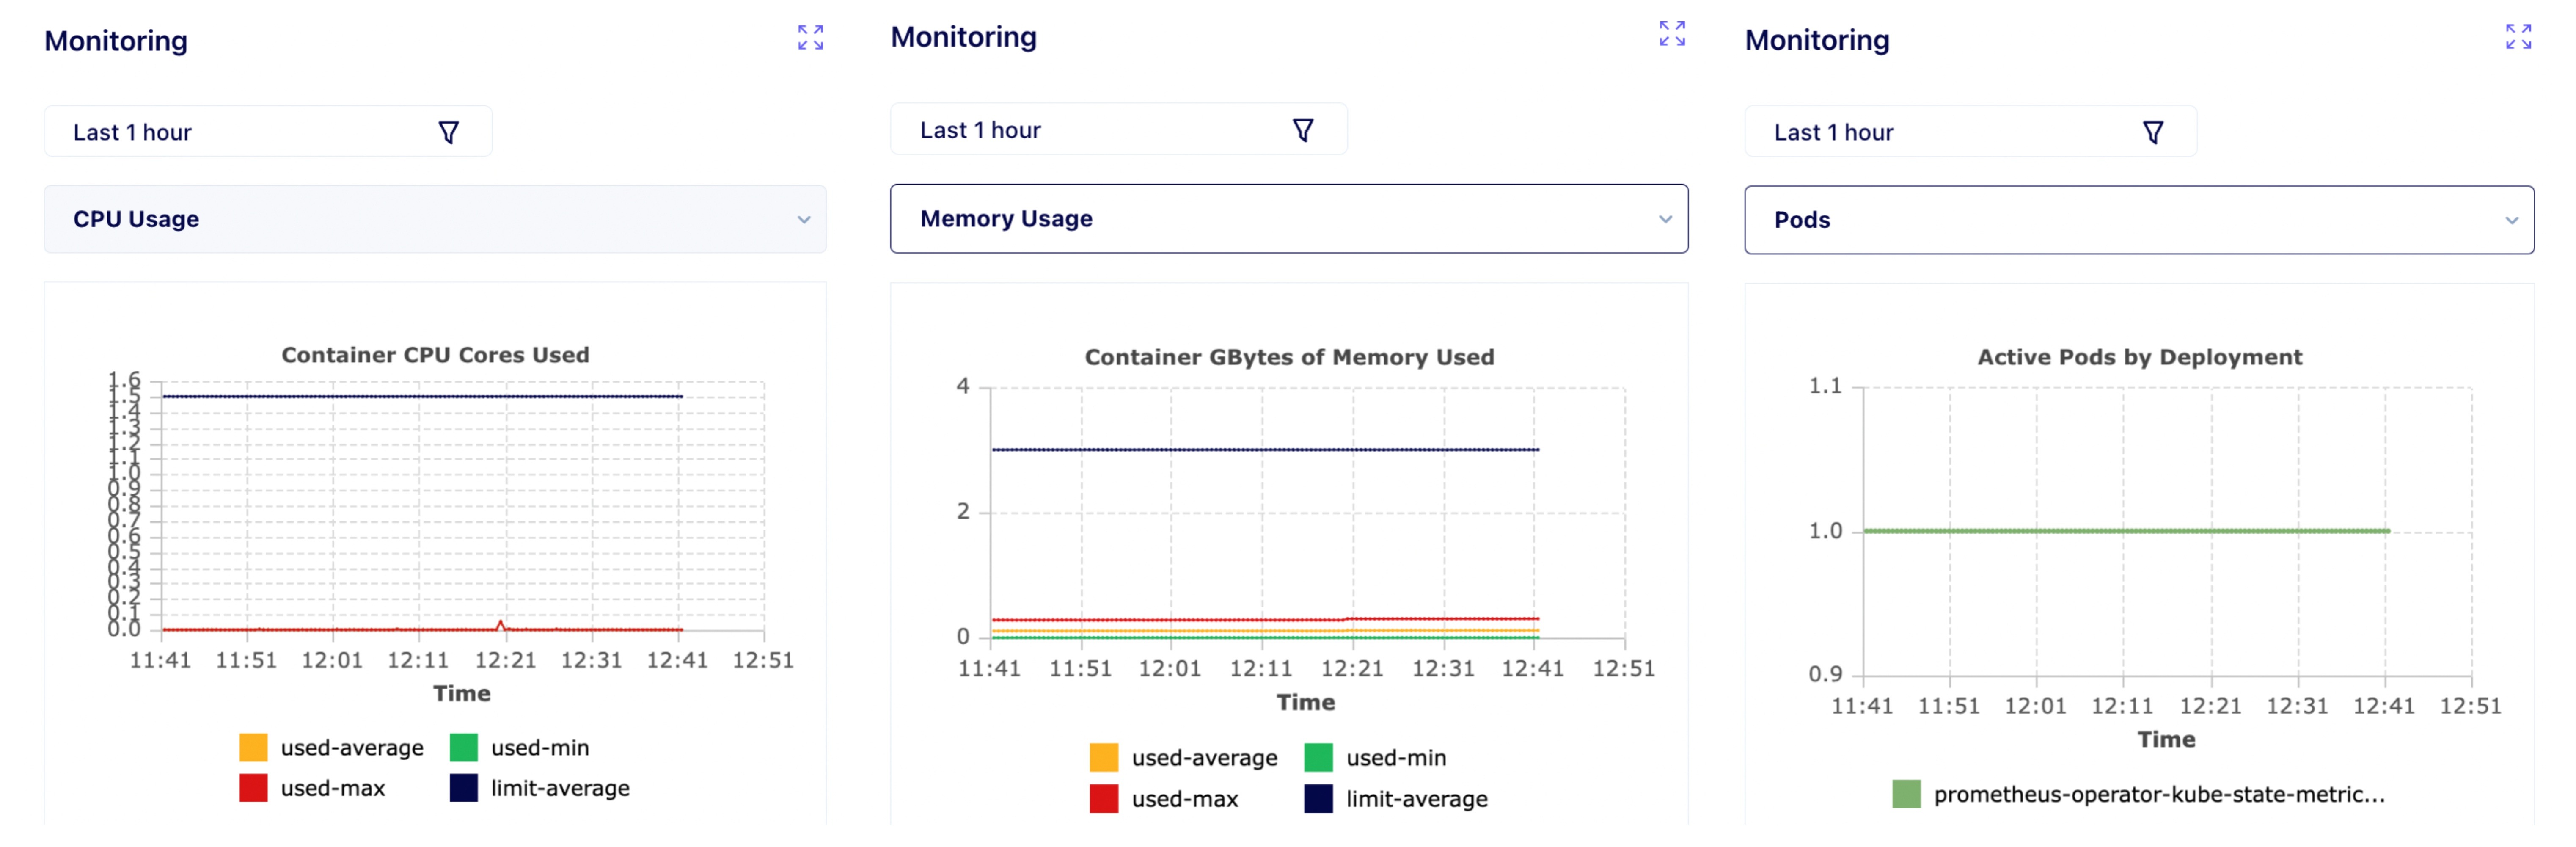
Real-time monitoring is facilitated through Grafana-powered dashboards, featuring:
- CPU Usage: Visualizes CPU consumption across your resources.
- Memory Usage: Tracks memory allocation and usage patterns.
- Pod Restarts: Monitors the frequency and reasons for pod restarts, aiding in troubleshooting.
5. Additional Dashboards
Depending on the selected resource type, additional dashboards may include:
- Ingress Overview: Details traffic routing, load balancing, and external access points.
- Historical Logs: Provides access to past logs for auditing and debugging purposes.
These dashboards adapt based on the resource type selected, ensuring relevant information is presented for effective management.
FAQs
Q1: How can I perform a rollback to a previous version?
Navigate to the Pipeline Activity section, expand the Version History table, and select the desired version to revert to using the rollback mechanism.
Q2: What actions are available for managing pods?
In the Kubernetes Dashboard, you can perform actions such as Rolling Restart, Refresh, Promote, and Abort.
Q3: What monitoring metrics are available?
The Monitoring Dashboards provide metrics on CPU Usage, Memory Usage, and Pod Restarts, visualized through Grafana dashboards.
Q4: Are the dashboards customizable?
Dashboards are tailored based on the selected resource type, ensuring relevant information is displayed for effective management.
Troubleshooting
Issue: Changes are not reflecting in the Kubernetes Dashboard.
- Solution: Ensure you have clicked the Refresh action to update the pod list. If the issue persists, verify your Kubernetes cluster's connectivity and health.
Issue: Unable to perform a rollback to a previous version.
- Solution: Confirm that the desired version is listed in the Version History. If it's unavailable, the version may not be eligible for rollback.
Issue: Terraform outputs are not displaying correctly.
- Solution: Check that your Terraform configurations have been applied successfully. Re-run the Terraform apply process if necessary and refresh the Live tab.
Updated 11 months ago