Environment Overview
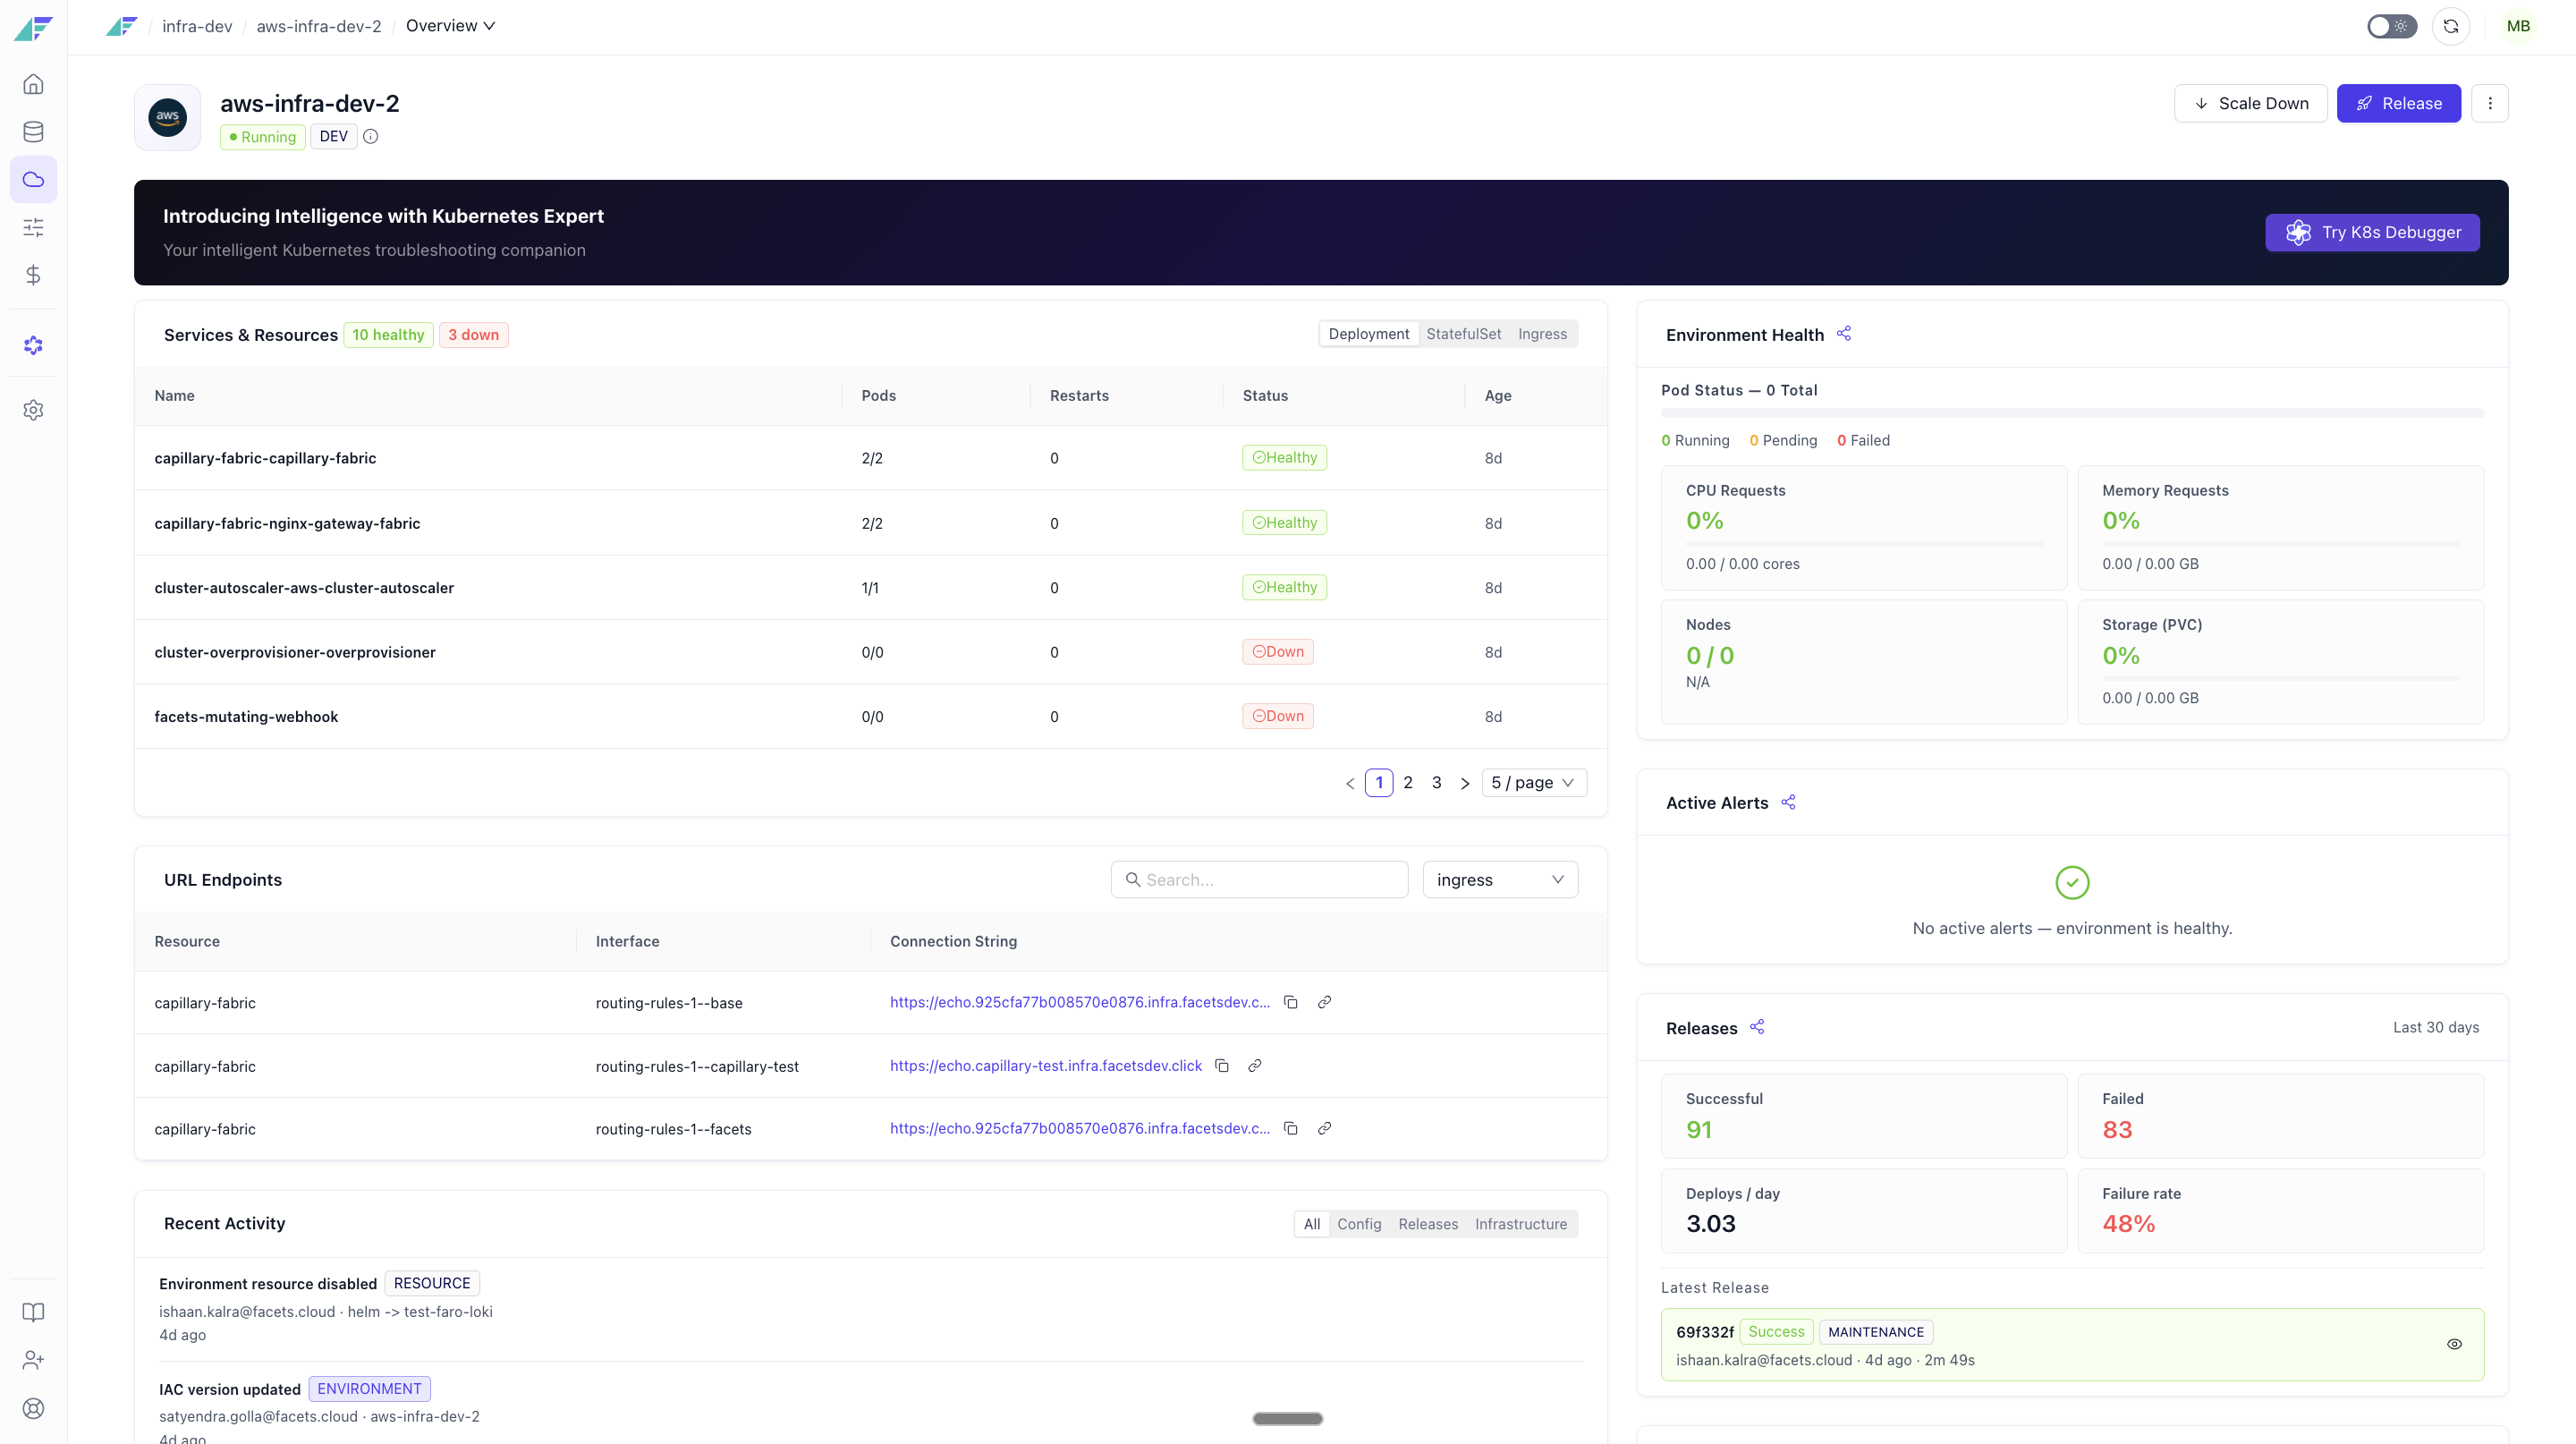
The Environment Overview is your operational home base for any environment in Facets. From here, you can assess infrastructure health at a glance, track live Kubernetes workloads, discover service endpoints, review the latest deployments, take environment-level actions - all without leaving a single page and much more.
Think of it as the cockpit for your environment: it tells you what is running, how well it is running, and gives you direct controls to act when something needs attention.
Note: If you open an environment that has not been provisioned yet, you will see an empty state screen with a Launch environment button. Click it to start the provisioning wizard, which guides you through selecting cloud resources and confirming the deployment. Once launched, the full dashboard becomes available.
Information and Actions
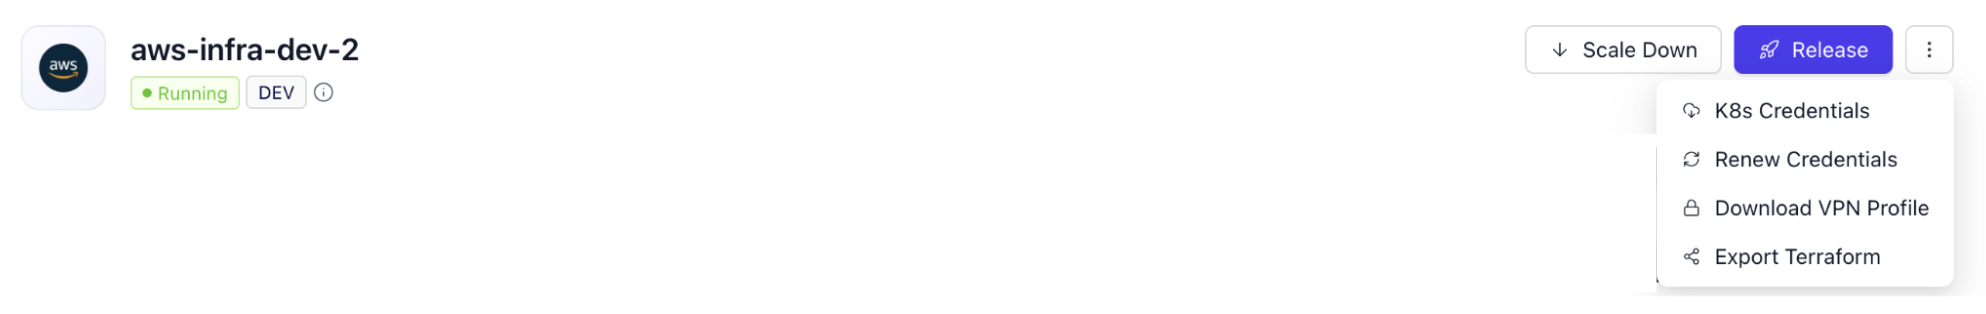
- Environment Status: Page shows your environment's current lifecycle state as a colored tag next to the environment name. Example: Running, Launch Failed, Destroy Failed, Stopped etc. It also shows additional tags like dependent (in case of dependent environment), release stream and release paused (if so).
- Environment Actions: The header provides buttons for all key lifecycle operations. Buttons appear and become clickable based on your environment's current state. Primary actions like Launch, Release, Scale Up/Down etc. are present. Additional options like download K8s credentials, renew credentials, export terraform etc. are present in the dropdown.
Capabilities
Finding Service Endpoints and Connection Strings
The Ingress & URL Endpoints card lists every accessible URL and connection string published by resources in this environment - including database hostnames, API endpoints, and internal service addresses.
Some connection strings contain credentials or tokens. These are displayed as "Secret — masked" and cannot be copied directly from the UI. Access these values through the resource's secrets configuration, or via environment variables injected at runtime.
Viewing Live Workloads
The Services & Resources card lists every Kubernetes workload running in this environment. It requires Kubernetes credentials. Use the category filter to switch between:
- Deployment — stateless application services
- StatefulSet — stateful workloads such as databases and message queues
- Ingress — routing rules and load balancers
Resource Utilisation
Four tiles show cluster-wide resource utilisation. Each tile uses a color-coded indicator:
Green: utilisation is healthy (below 65%), Yellow: elevated utilisation; monitor closely (65–85%), Red: high utilisation; consider scaling up (above 85%)
| Tiles | What It Shows |
|---|---|
| CPU Requests | Percentage of CPU capacity requested by running pods, with raw core counts |
| Storage (PVC) | Percentage of persistent volume storage in use, with GB values |
| Nodes | Number of ready nodes out of total nodes, with node types listed |
| Memory Requests | Percentage of memory capacity requested, with GB values |
Monitoring Environment Health
The Environment Health card gives you a real-time snapshot of your Kubernetes cluster's resource consumption. It requires Kubernetes credentials to be configured for this environment.
The total pod count and restart count over the last hour are shown alongside the bar. A high restart count on a pod often signals a crash loop or misconfiguration.
There are many other things like recent activity of the environment, tracking releases and deployments, k8s AI Debugger etc. that are also present in the environment overview page.
Important:* An environment can only be deleted after it has been destroyed.
Updated 10 days ago